Model built by U of T researchers suggests coronavirus outbreak began in November, has yet to be controlled

Published: February 7, 2020
The coronavirus epidemic started one month earlier than is commonly reported and has yet to be brought under control, a new disease-transmission model created by University of Toronto researchers suggests.
Using open access data that are updated daily, the model replicates epidemiological scenarios and allows researchers to test narratives about the outbreak that originated in Wuhan, China – including the notion that it started in December.
The work is detailed in the Annals of Internal Medicine while the model itself can be found here.
“You can’t get up to that level of cases if the epidemic started in December even if you pushed the reproduction really high,” says David Fisman, a professor in the Dalla Lana School of Public Health and one of the model’s creators.
“If you have a reproduction number of three, the epidemic could not have stated in mid-December because, according to the graph, it is undershooting the cases that were found in December.”
In epidemiology, reproduction refers to the number of secondary cases a single case can infect in a susceptible population.
“It had to be earlier, which raises some interesting questions about how this emerged,” Fisman says. “The plausible start date seems to be mid-November.”
The tool also shed insights into the international effort to contain the spread of the virus.
Working with Ashleigh Tuite, an adjunct lecturer at Dalla Lana, Fisman points to two green dots on the interactive graph. The Chinese government implemented containment measures by mid-January, but, according to the graph, the disease’s reproduction number has not yet been reduced below one – the level needed for control.
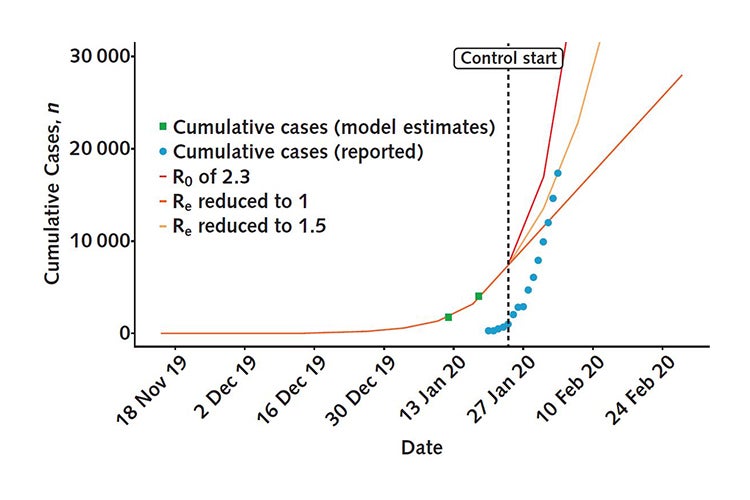
“Even with the reproduction being less than one ... when looking at Jan. 14, that level control is not happening because the observed cases are exceeding that level,” Fisman says.
Reproduction numbers have not been less than one since the World Health Organization formally declared the epidemic a public health emergency of international concern on Jan. 30, according to the model.
Fisman says it takes about a week to infect someone and for the person to exhibit the virus’ symptoms. “What you’re seeing today [in the graph] is what happened last week.”
The model also allows users to create plausible epidemic curves or scenarios to observe the outbreak’s trajectory. Fisman says it is a simplified version of reality that can rule out ongoing narratives.
“You can play with this to see how the response is doing,” he says. “It’s a qualitative tool, but there’s also a lot we can’t say with certainty. If the cases take a sharp right turn and stop going up, there are two possibilities: control has been achieved or they are running out of resources. We can’t distinguish those with the graph alone.”
Fisman and Tuite will be working on the virus’s lethality for an upcoming paper.