Text visualization: U of T researchers develop system for medical records
Published: November 21, 2018
Nicole Sultanum says one of the fastest ways to understand information is by sight.
“We’re much faster at recognizing patterns,” says Sultanum, a University of Toronto PhD student in the department of computer science and its Dynamic Graphics Project lab.
“If it’s a table of numbers versus a chart, a chart is much faster for you to find how the data is distributed. When text is used, things get a little bit more complicated because somehow you have to translate text into something the computer can understand, which is one of the biggest challenges with text visualization.”
Sultanum, whose research examines text visualization for clinical use, recently presented “Doccurate: A Curation-Based Approach for Clinical Text Visualization” at the IEEE VIS conference in Berlin.
Her co-authors include Dr. Devin Singh, an emergency room physician at Hospital for Sick Children (SickKids), and her graduate co-supervisors in computer science, Professor Michael Brudno and Assistant Professor Fanny Chevalier.
Brudno is an expert in computational medicine and Chevalier specializes in data visualization.
Singh, who completed his pediatric residency training and a two-year pediatric emergency room fellowship at SickKids, knows all too well the need for text visualization tools in medicine.
“I am the end-user of a tool like this, which gives me a unique perspective,” he says.
His research interests include the implementation of machine learning for clinical practice, which led him to collaborating with Brudno, who is also the director of SickKids' Centre for Computational Medicine. Brudno is supervising Singh’s pursuit of a master's degree in computer science at U of T.
“My idea is to take my understanding of medical nuance, learn from experts like Nicole and build solutions that bridge the gap to enhance patient care,” says Singh.
Consider the time restraints of family physicians, says Sultanum. They typically meet patients for 15 minutes and likely have no more than 15 minutes between patients to review files. But if a patient with a long medical history meets with one doctor and then another, the researchers suggest it is improbable that both doctors will spend a lot of time reading over the full patient history.
“If you have a patient with a really long history, the doctor is going to ask the patient what the highlights are. There’s no guarantee the patient is going to give them an accurate, complete description of their condition. They might not remember – but it’s in the record,” she says.
Sultanum observed and interviewed a number of physicians at SickKids and clinics around Toronto.
Their datasets include more than 300 pages of medical chart notes for each patient. Conditions mentioned throughout a medical chart are visualized as steamgraphs, string-like graphs with droplets that expand upon recurrence of terms. For example, a larger droplet around hypertension would mean it’s an issue for the patient. Each condition is labelled with a different colour.
“It is hugely valuable to be able to very quickly look at a single screen that shows me a visualization that’s an accurate summation of a patient's medical record,” says Singh. “I can then rapidly go from assessing an unwell patient to making my clinical decisions confidently.”
Singh says what makes Doccurate unique from other medical visualization tools is the ability to customize. For example, a blood clot could be associated with any number of diseases, but he says he can classify it so that the end visualization is mapped out to the correct medical condition.
“It’s communicated to me in a visual way, which helps link the mental models of physicians together, creating a holistic care team through visualization.”
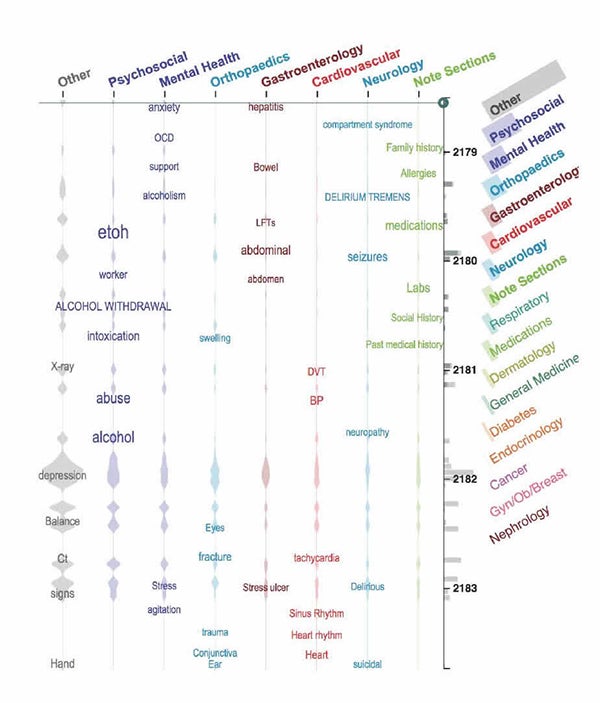
An overview of a complex patient with preset filters in Doccurate. Highlights on “alcohol”, “intoxication”, “alcohol withdrawal” and “delirium tremens” provide consistent hints of a significant and adverse history of alcohol abuse, with multiple episodes of withdrawal and related symptoms
Sultanum says the next stage of her research will be to provide a visual sense of narrative and progression as to how the patient has evolved over time. She’ll start exploring this idea using natural language processing datasets during a four-month research visit at Inria Saclay, one of the many French institutes for research in computer science.
Getting Doccurate from proof of concept into further clinical trials is another challenge, but Singh believes that the timing is right. Just this past summer, SickKids went digital with a new electronic health information system, Epic. With more hospitals advancing their electronic health information systems, Doccurate will have more opportunities for clinical use.
“People are ready to ask the question ‘How do we take this electronic medical record system and find other value-adds?’” he says.
“We can create a bridge between medicine and computer science so that these types of solutions can be implemented to enhance patient safety and the quality of care we deliver.”